Darktrace Cloud
Ranking multi-cloud alerts by what they can actually reach — so an analyst sees the one that matters before the ninety that don't.
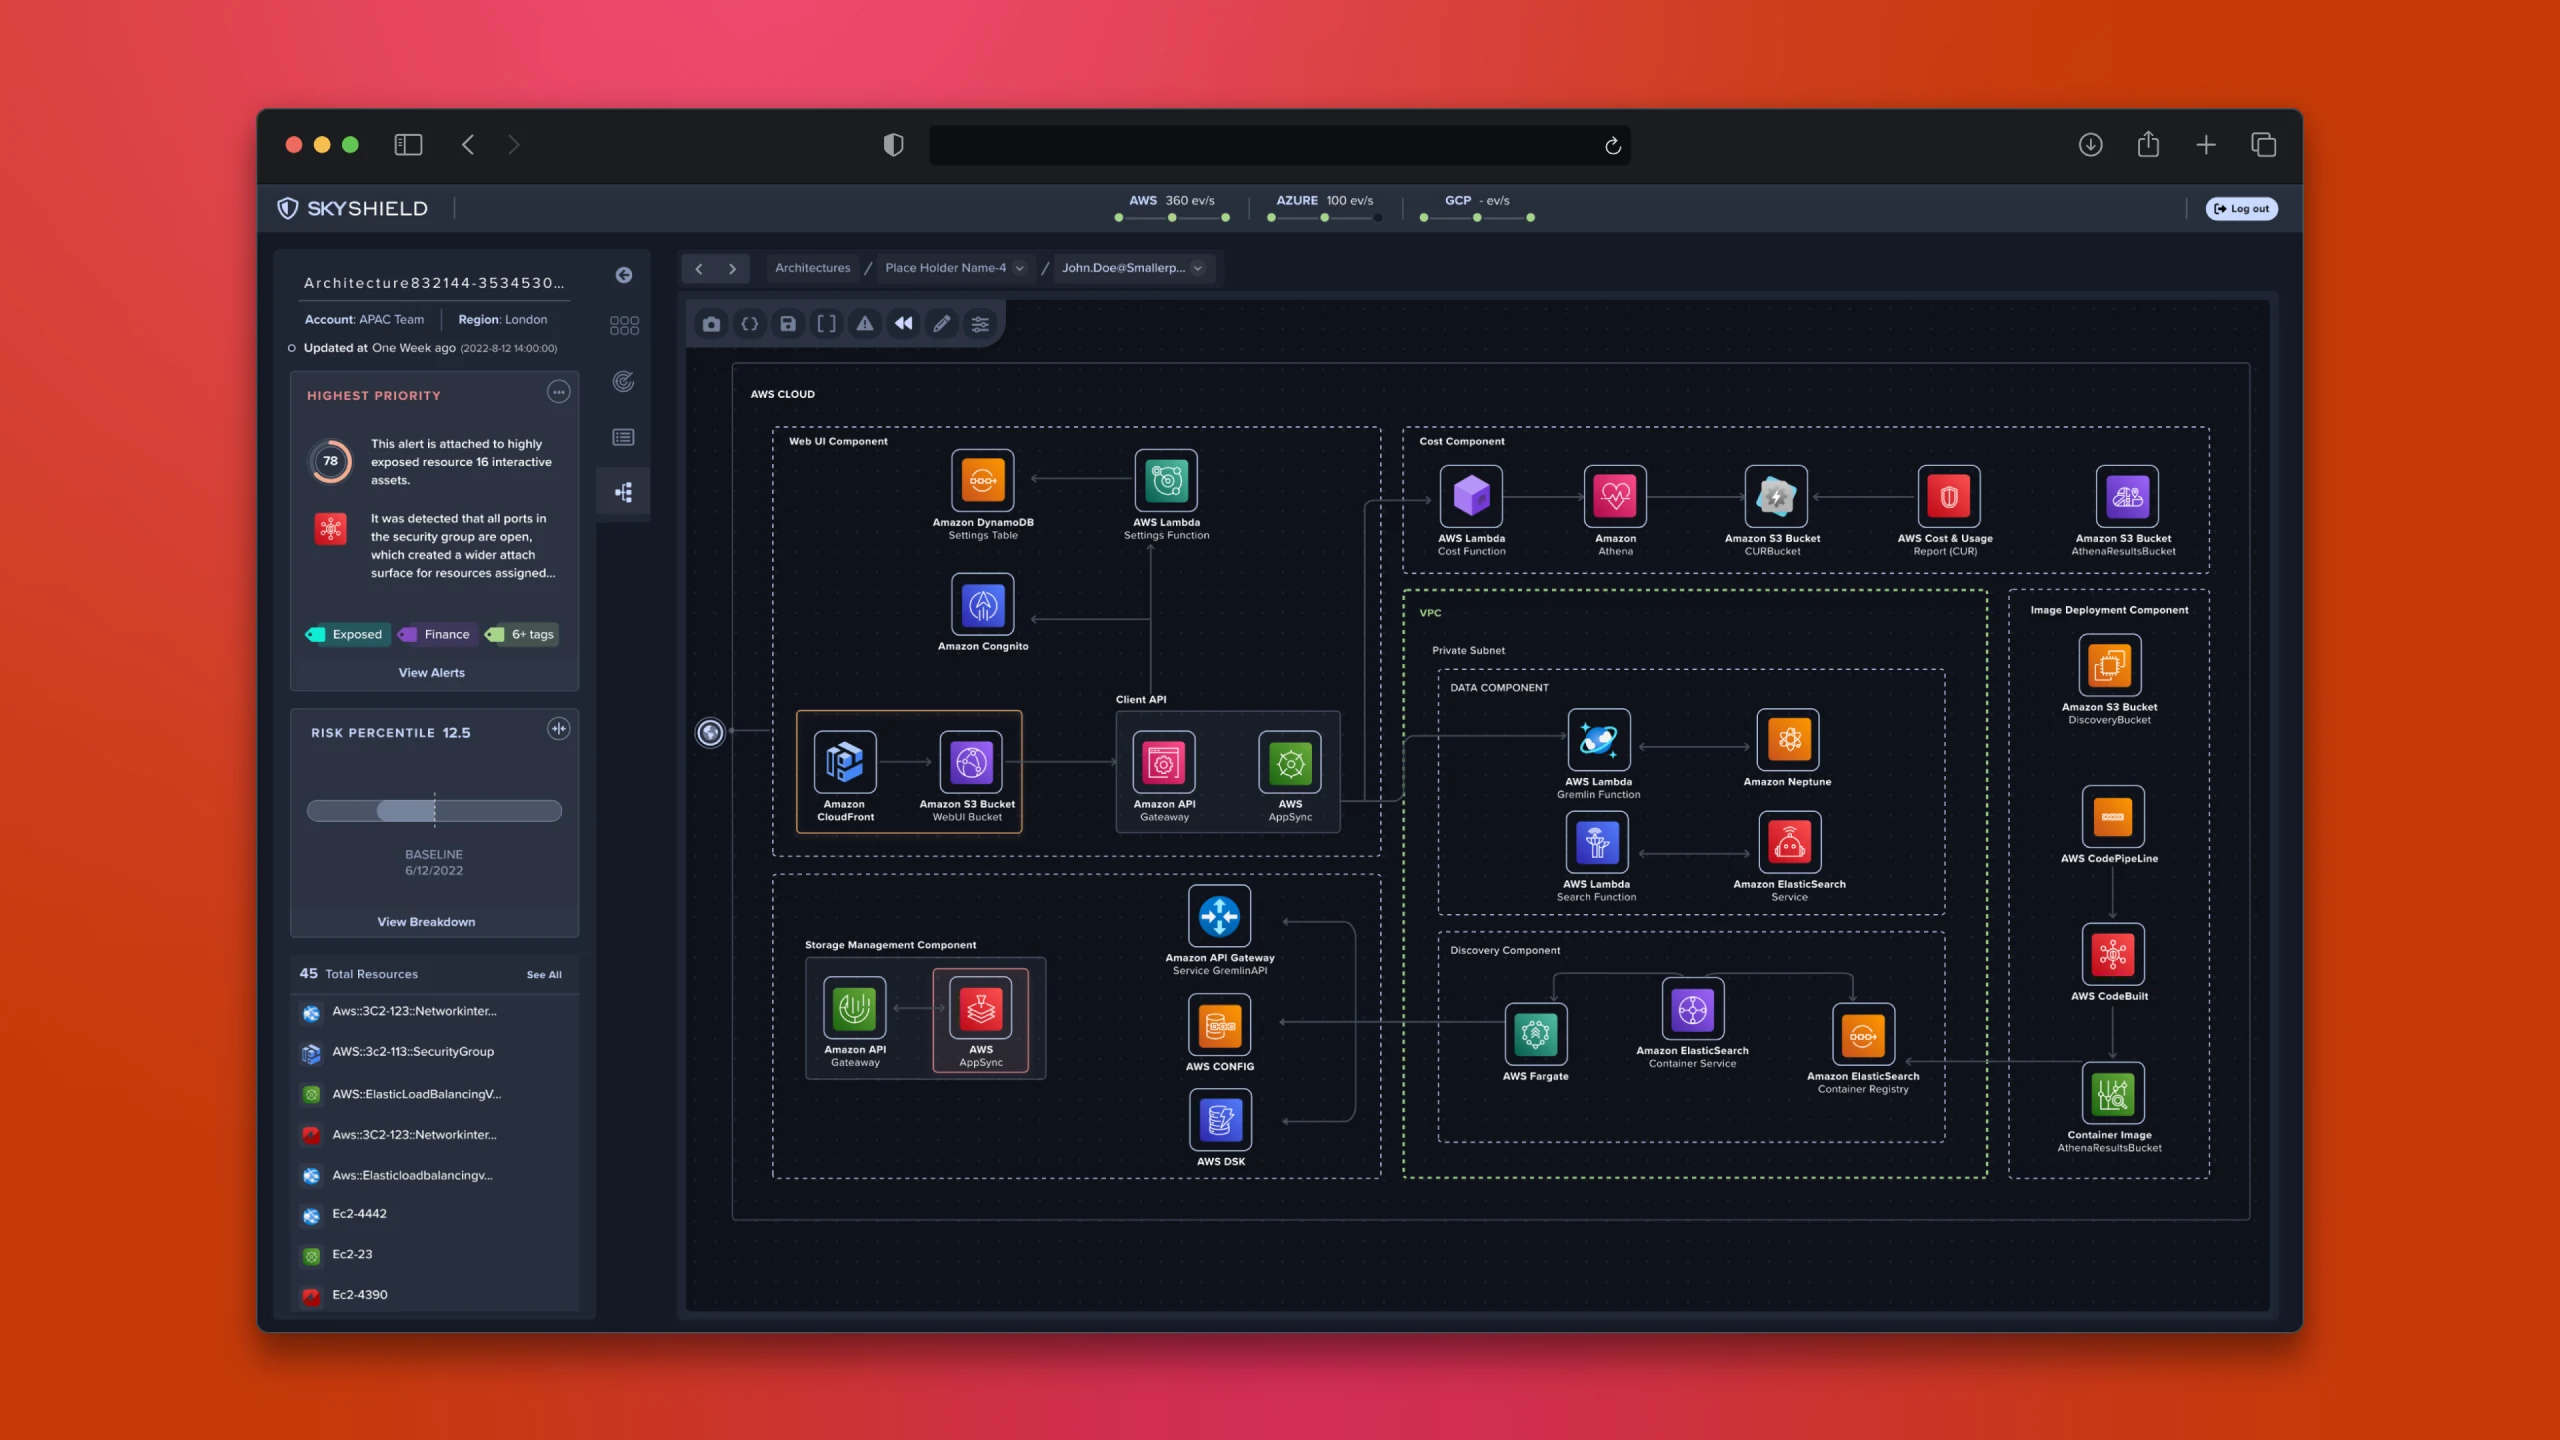
Security for infrastructure as a service.
SkyShield secures whatever a company runs across AWS, GCP and Azure. My part was the half that decides whether any of it is usable: how thousands of connected assets and a constant alert stream become a screen someone can actually act on.
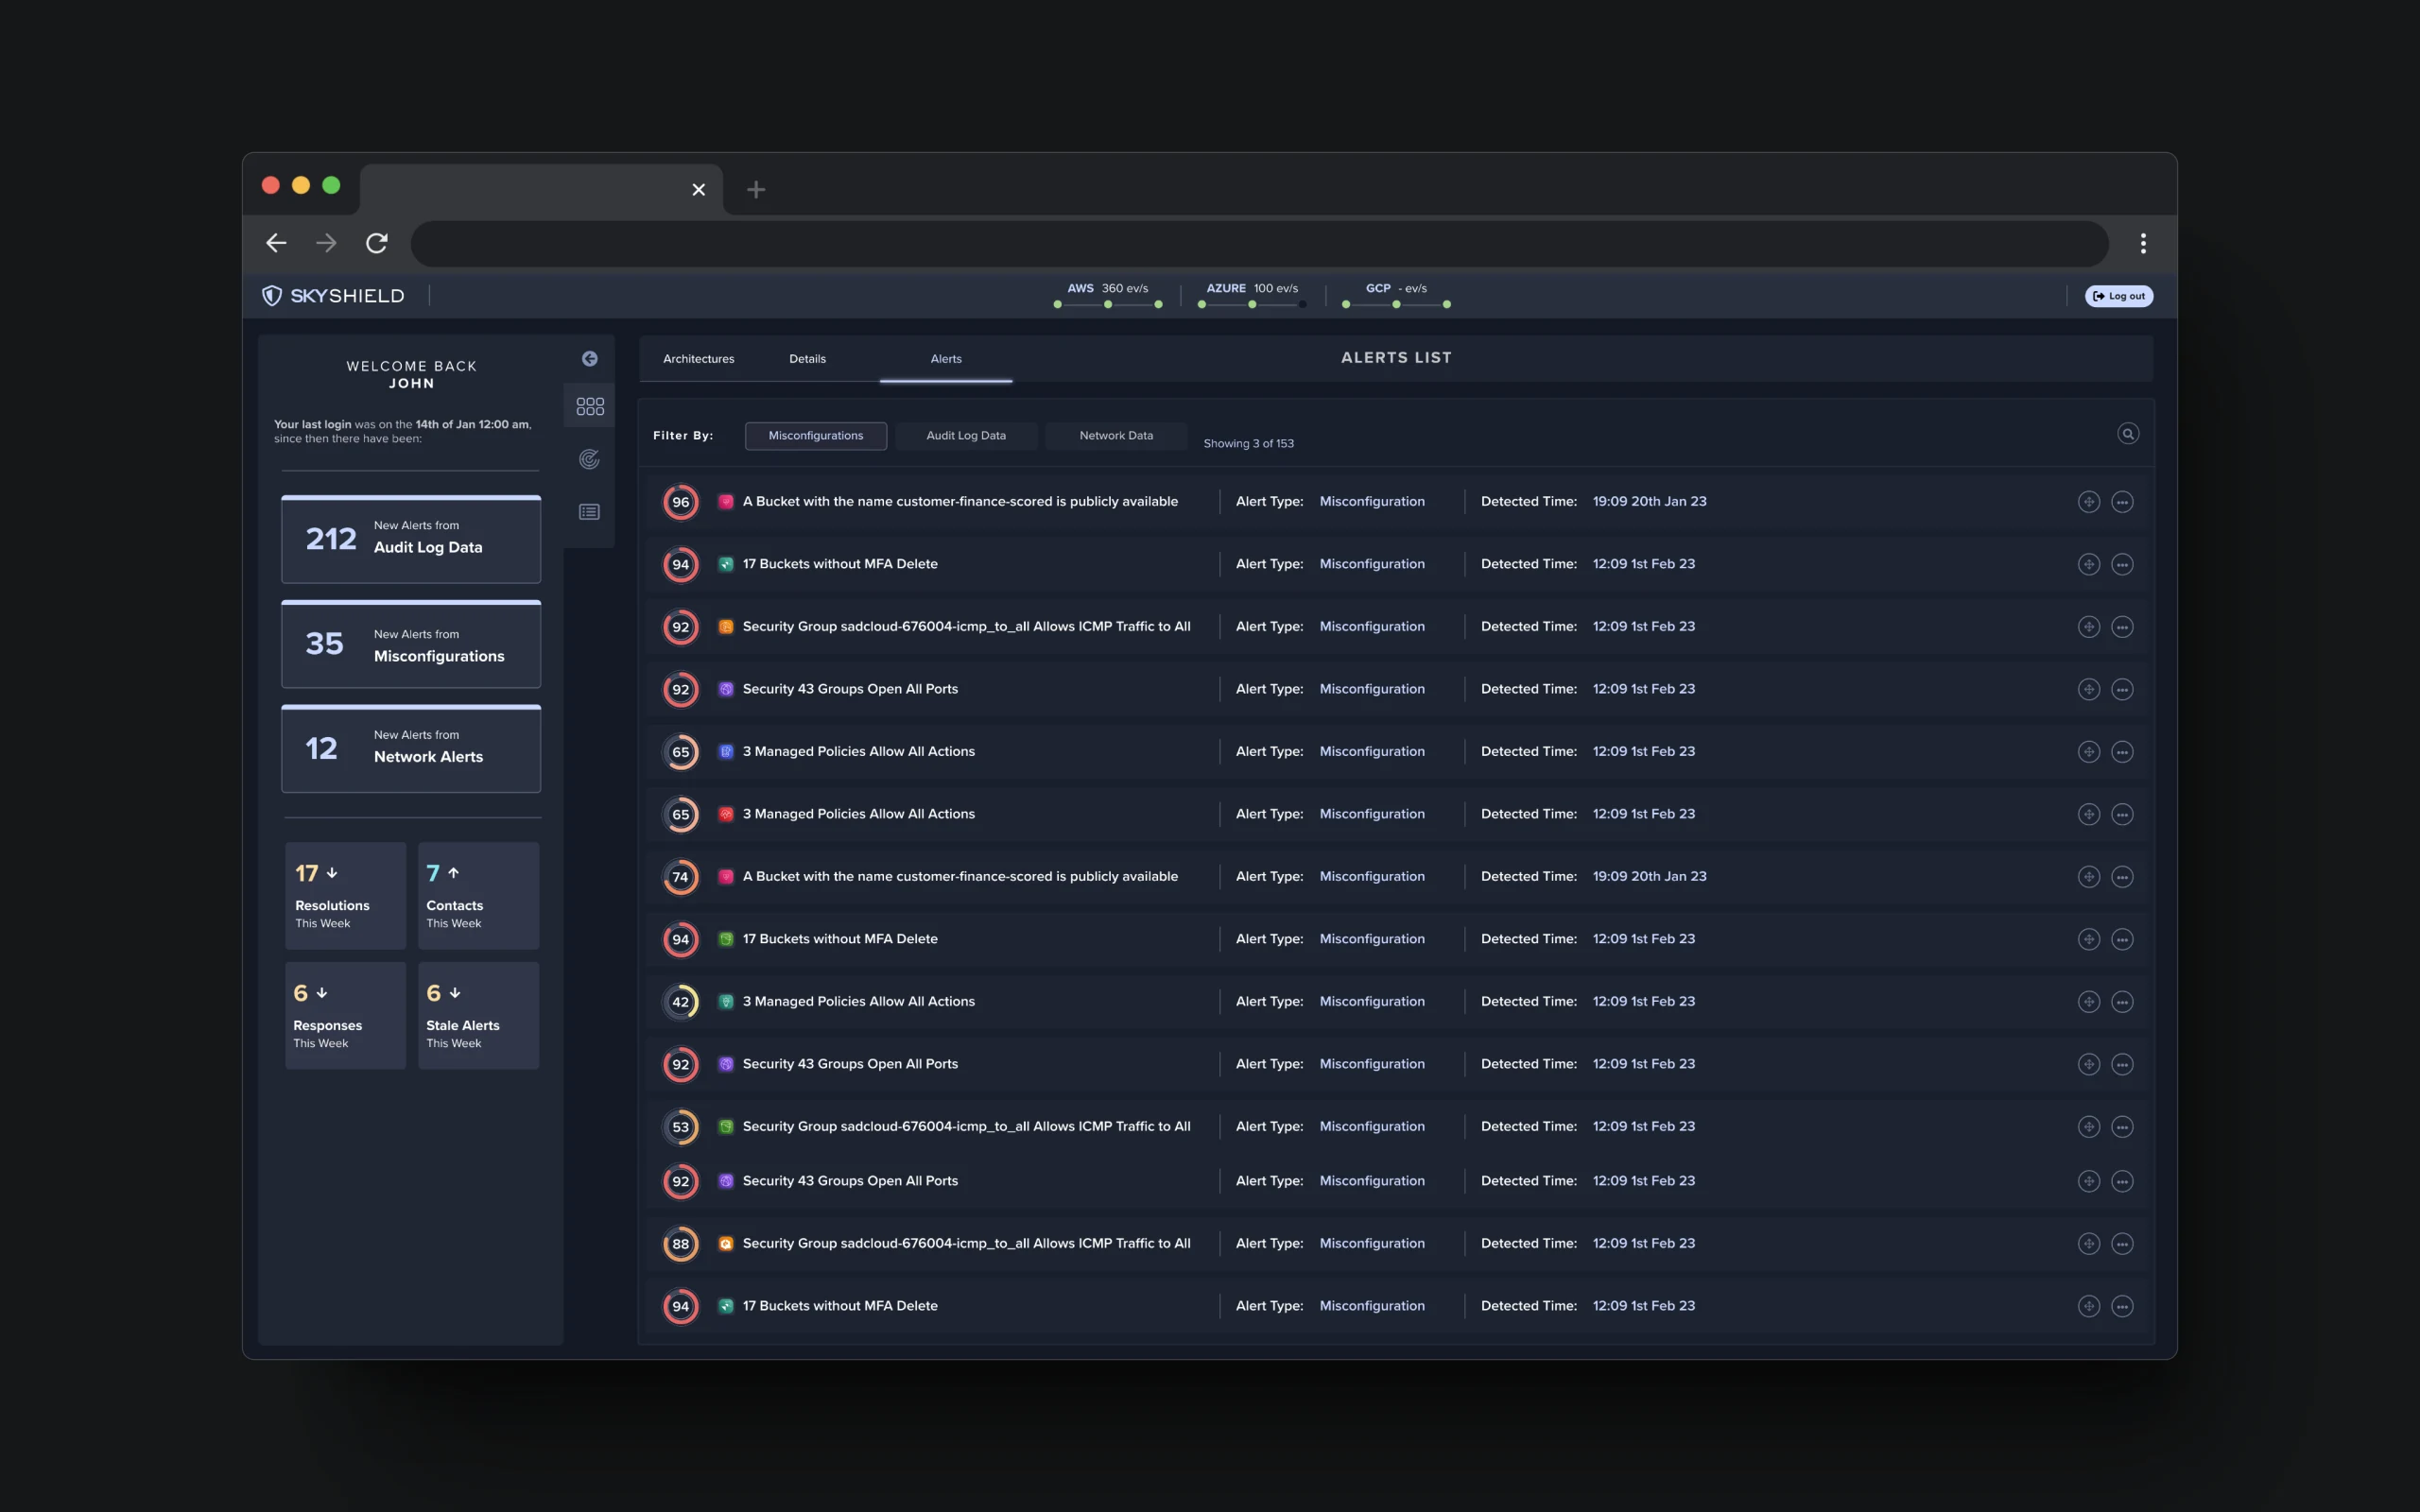
The engineering was already ambitious — a graph back end linking every asset, a contagion model scoring alerts by blast radius. None of that meant anything until an analyst could see why one alert mattered more than the ninety behind it. So the interface is organised by consequence rather than volume: rank by what an alert can reach, then let someone follow it to root cause without losing their place in the list.
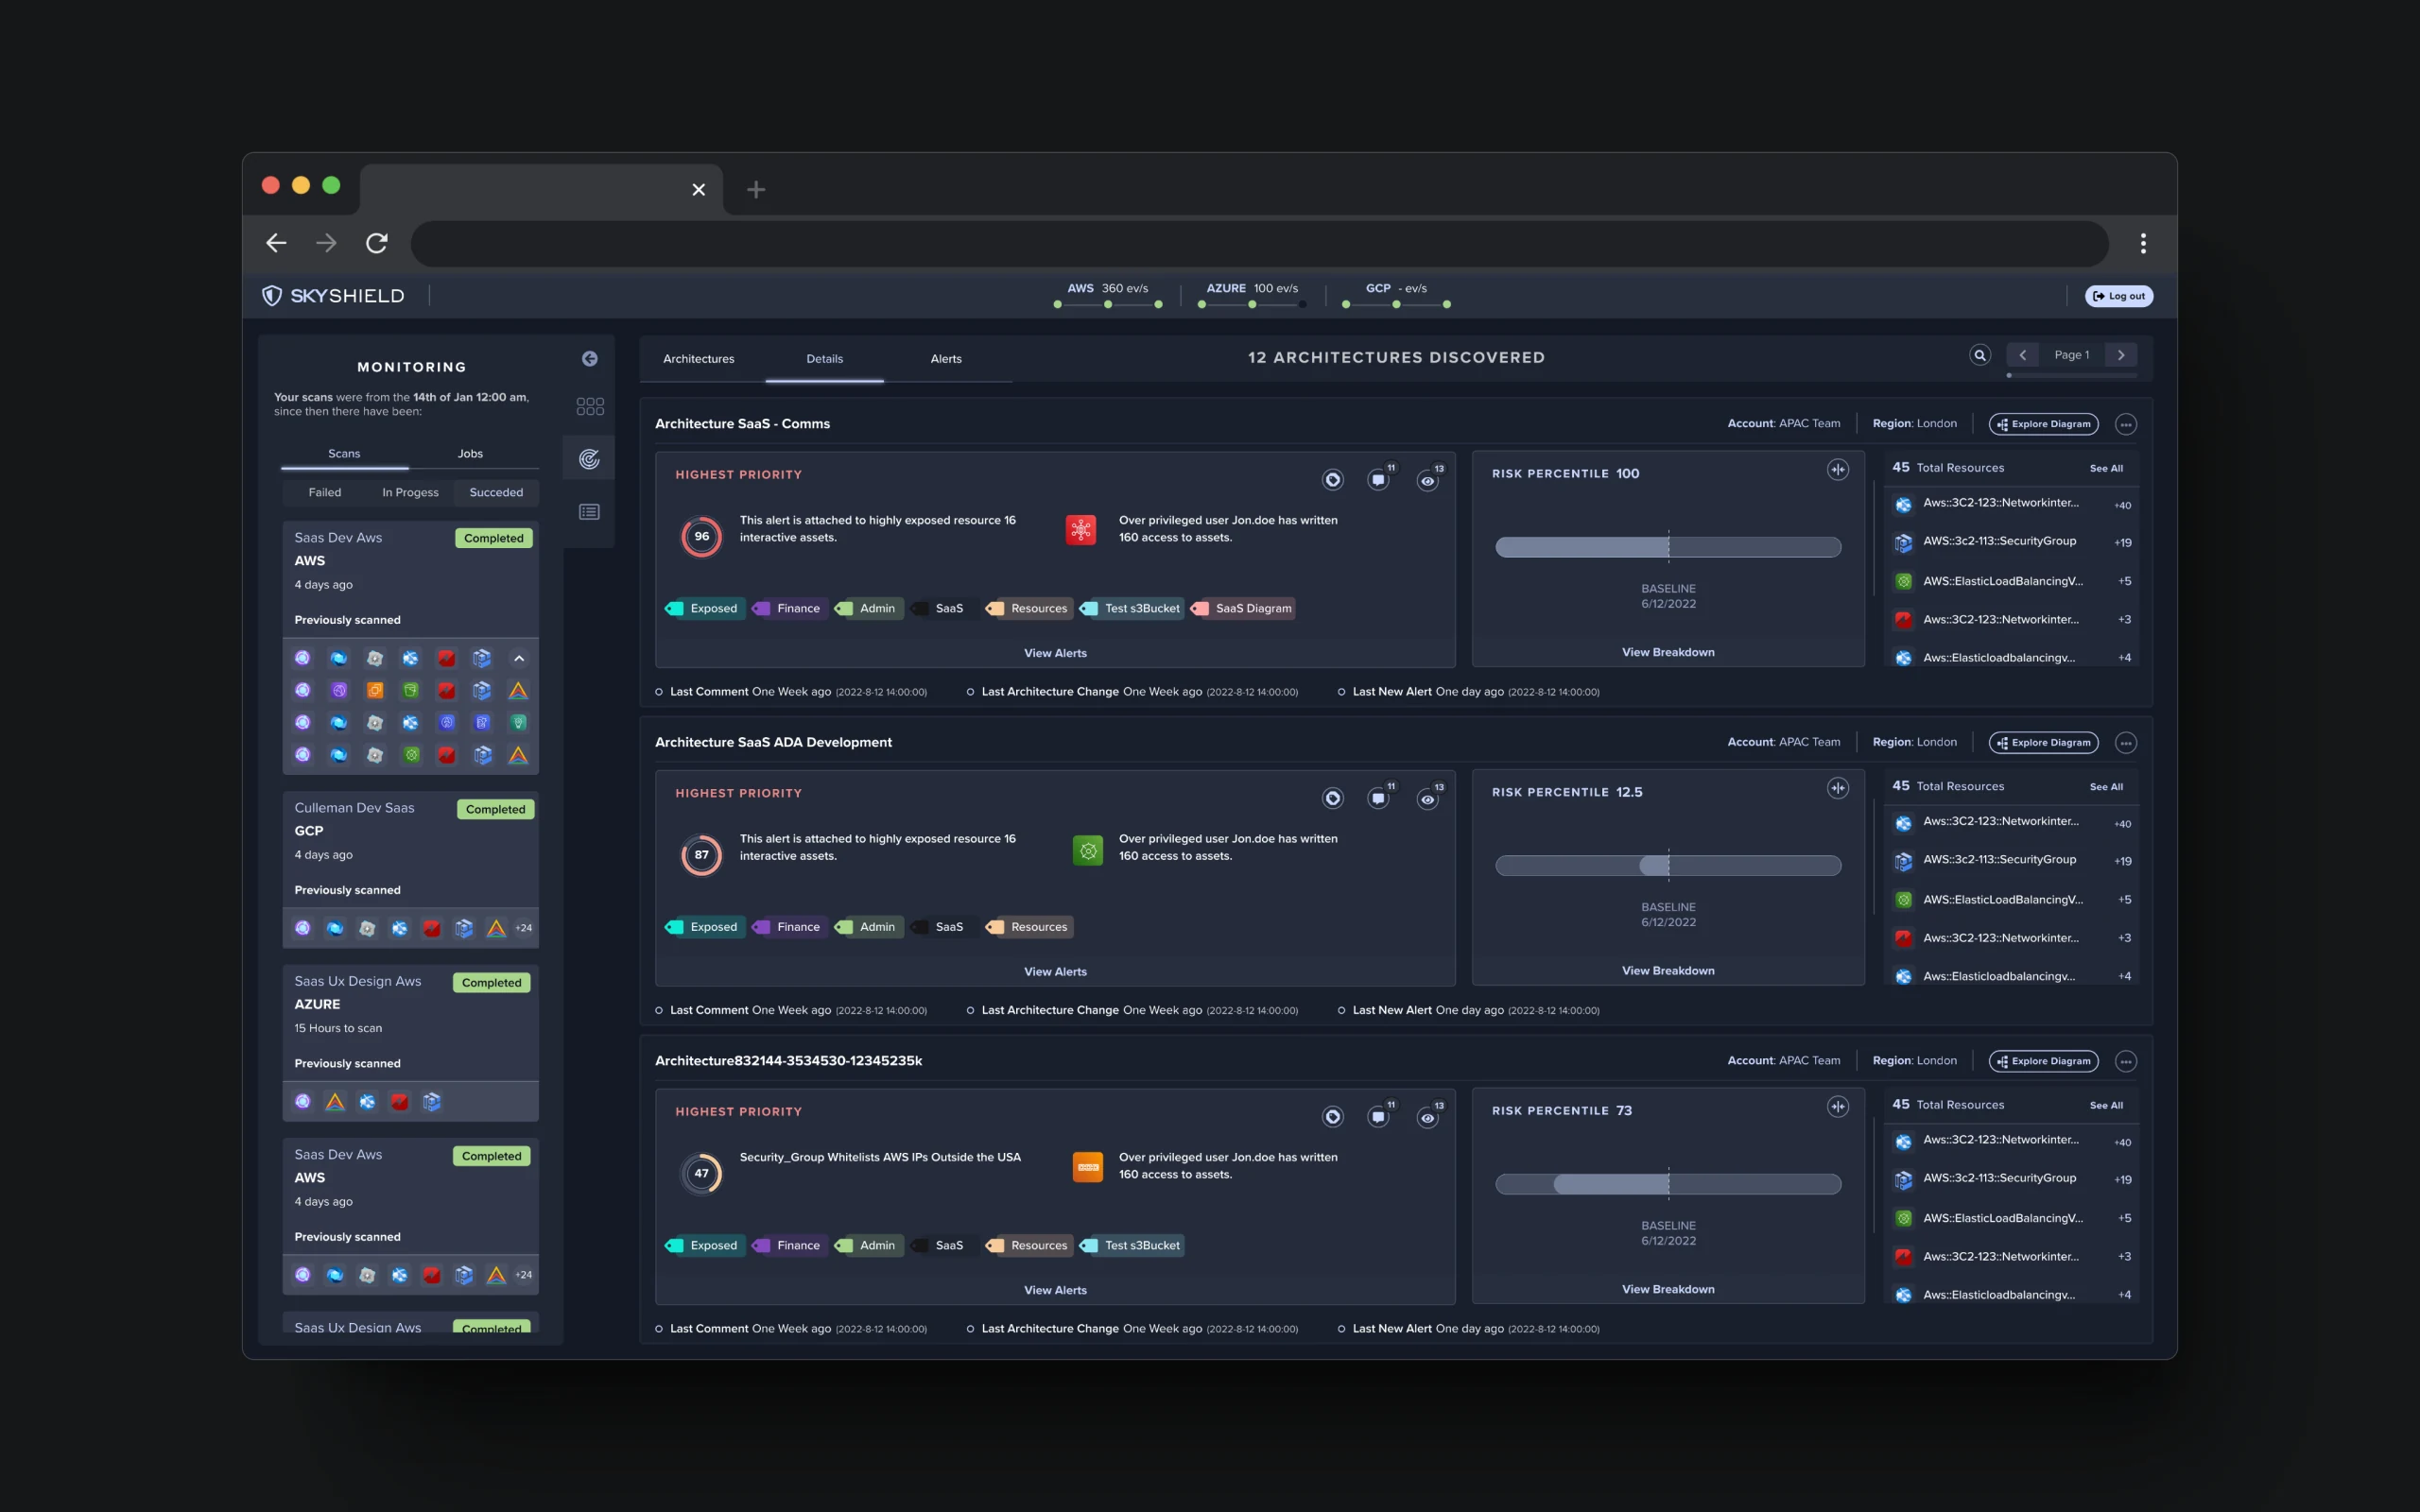
A complex landscape of cloud services.
Existing tools couldn't prioritise alerts or offer a single, comprehensive view of the infrastructure — leaving teams to manage sprawling, multi-cloud environments by hand.
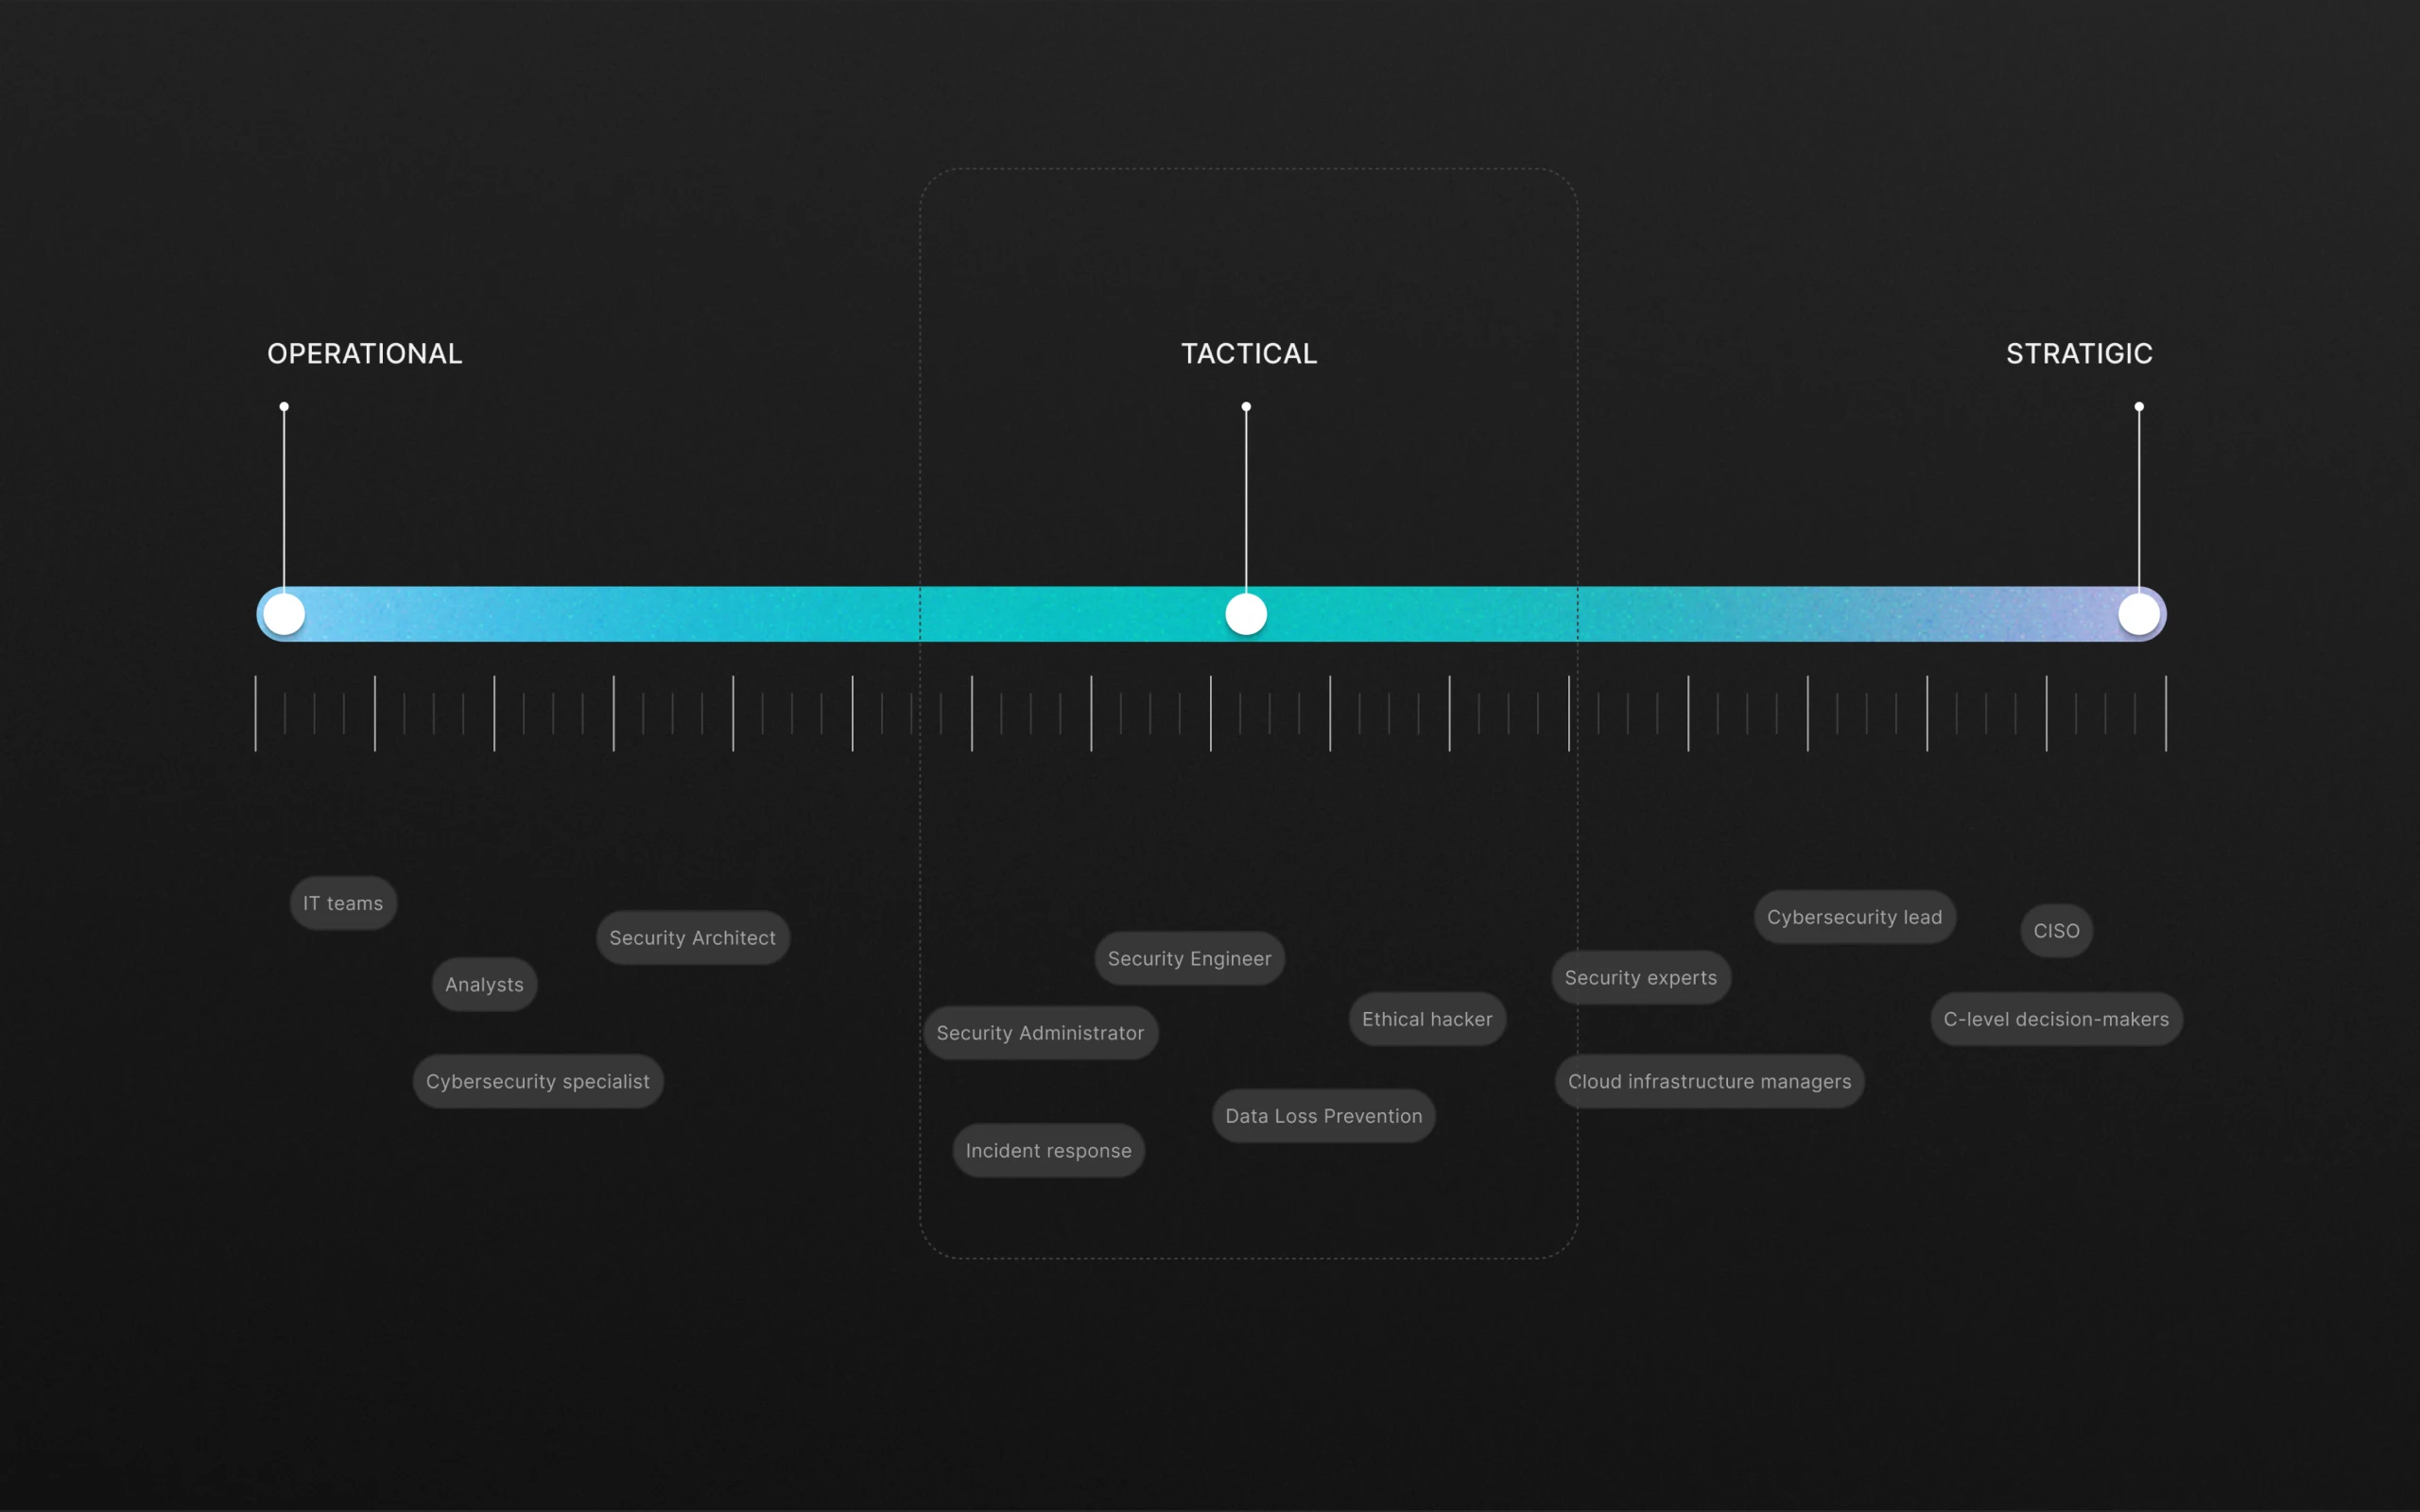
Two things made this hard to design rather than just hard to build. Multi-cloud assets have no shared shape — an S3 bucket, a GCP service account and an Azure VM are not comparable objects, but they have to sit in one list. And the people reading that list were no longer only analysts: the research workshop put DevOps and cloud infrastructure engineers in the same screens, with different vocabulary and a much lower tolerance for security jargon.
Finding structure amidst the chaos.
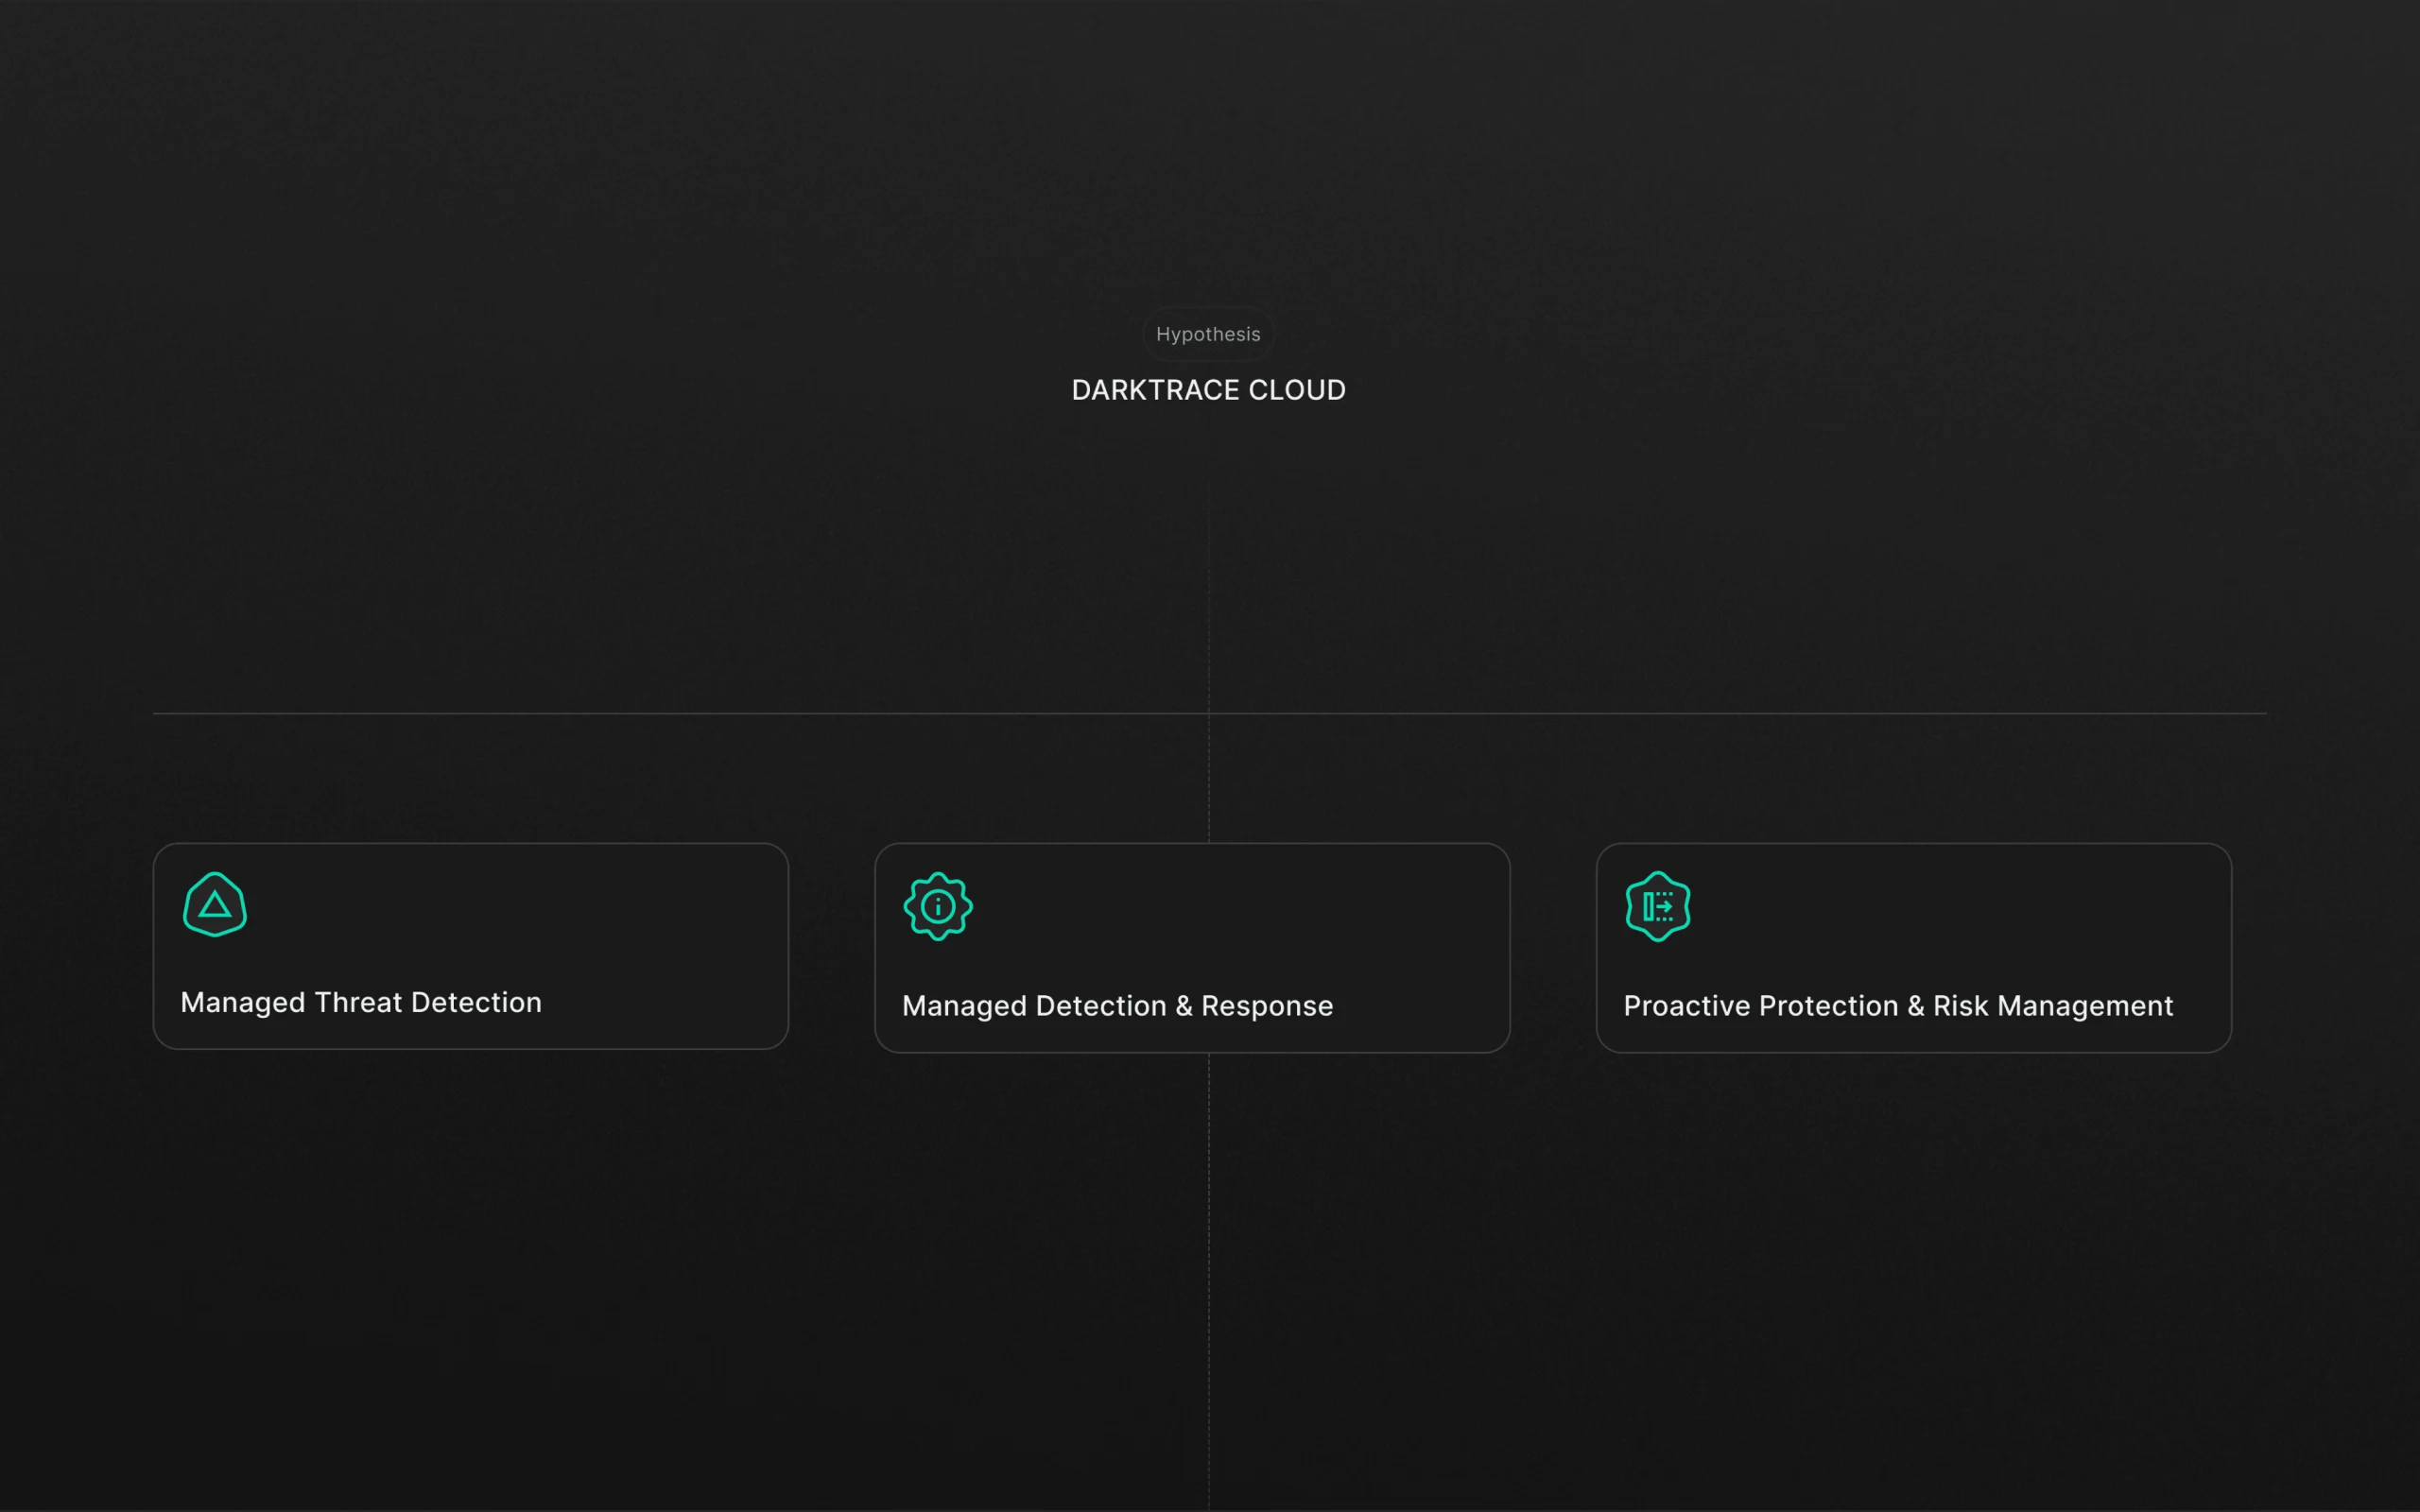
A research workshop showed we had to design beyond traditional security teams — for cloud infrastructure experts and DevOps too. So I mapped where real-time monitoring fits the wider cloud-security lifecycle before designing a screen.
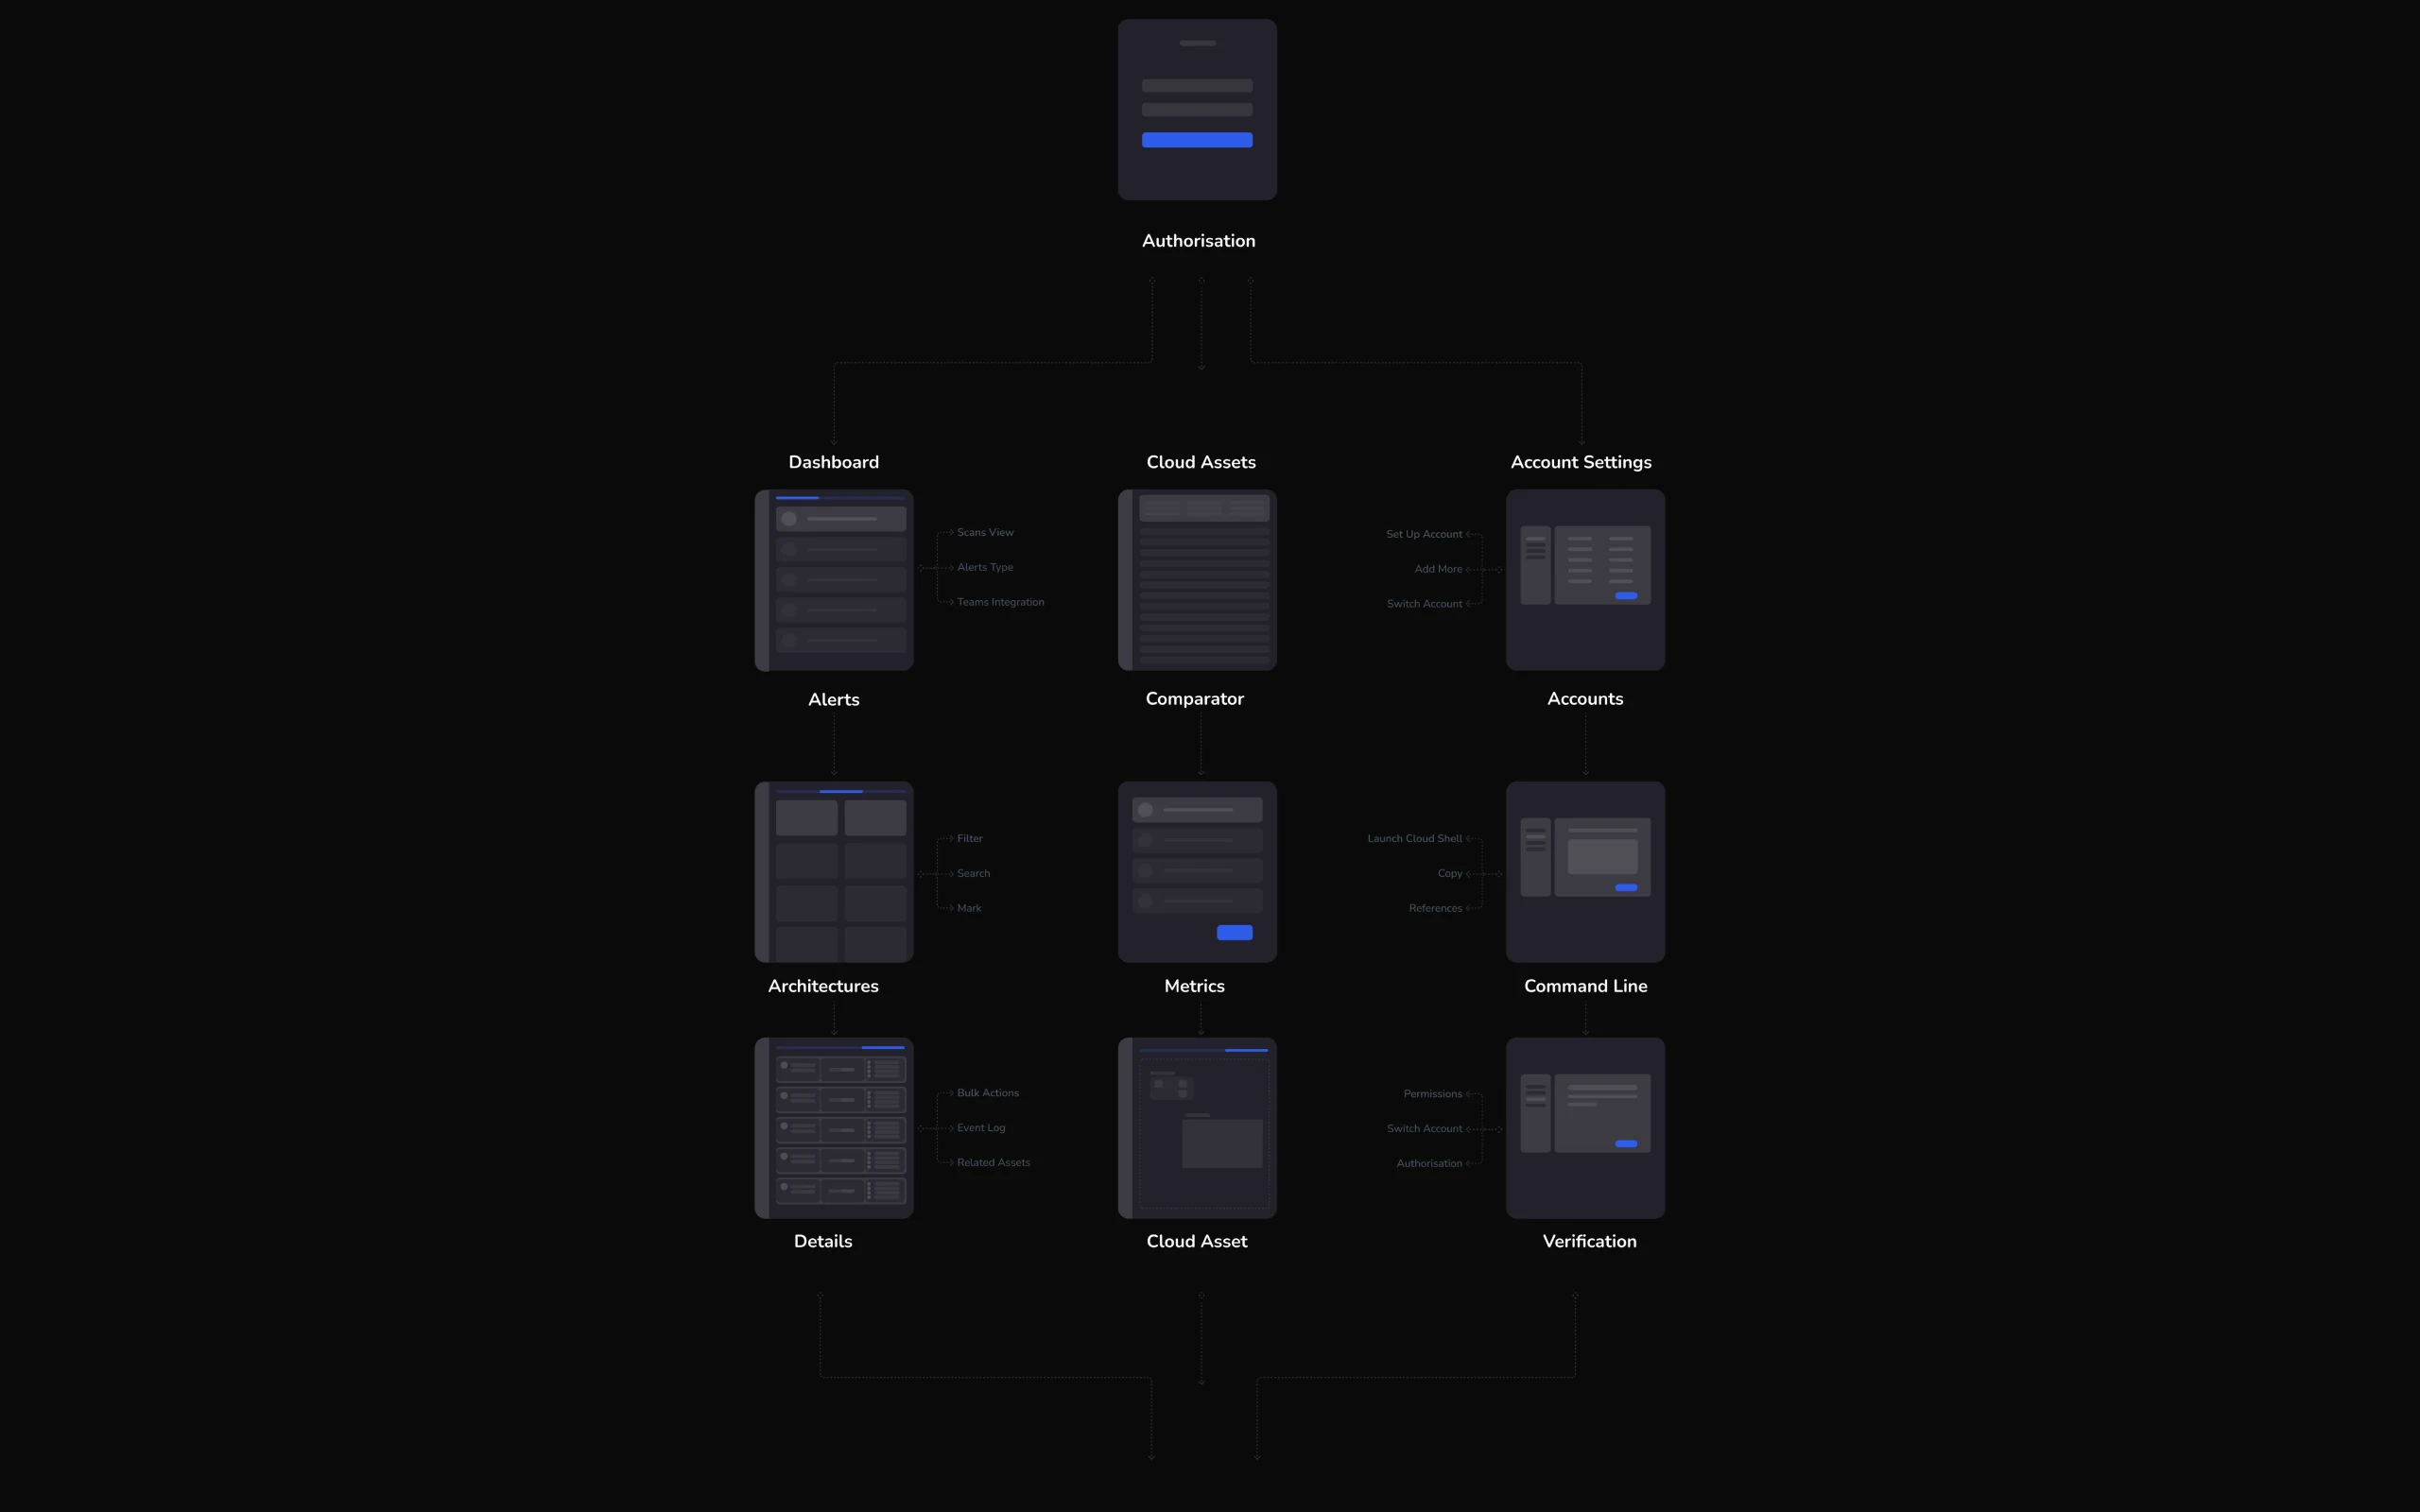
A modular approach to data representation.
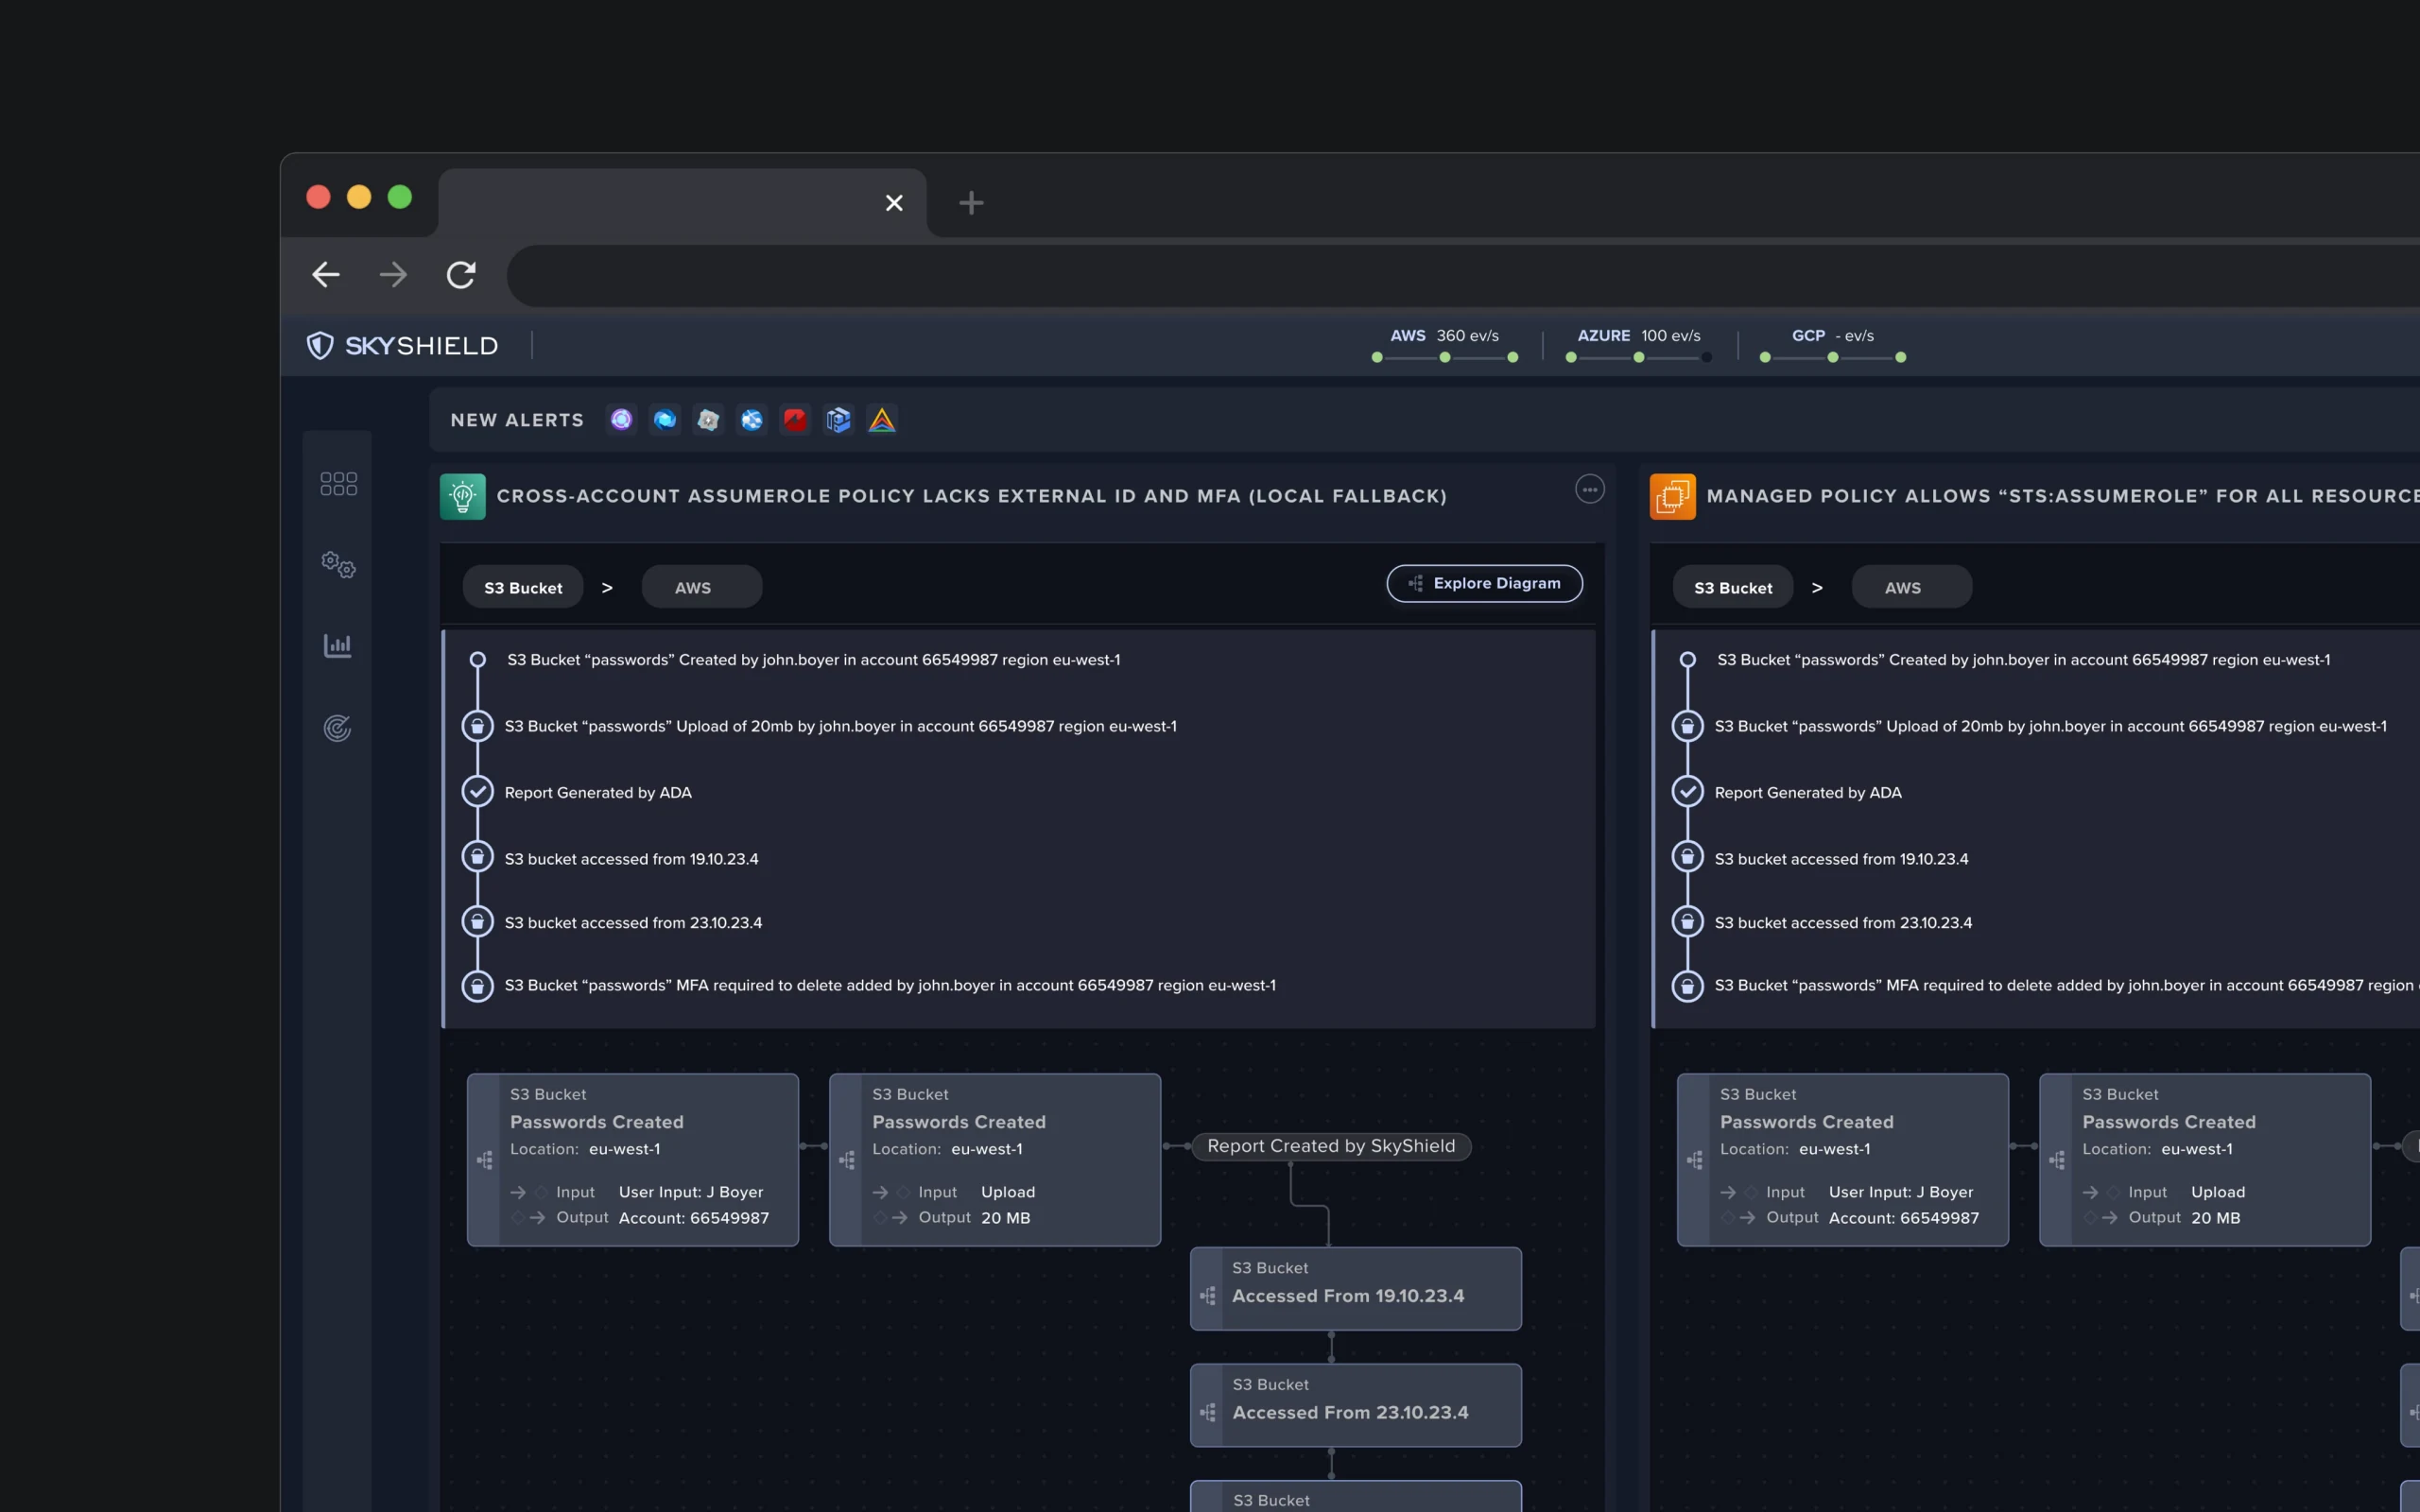
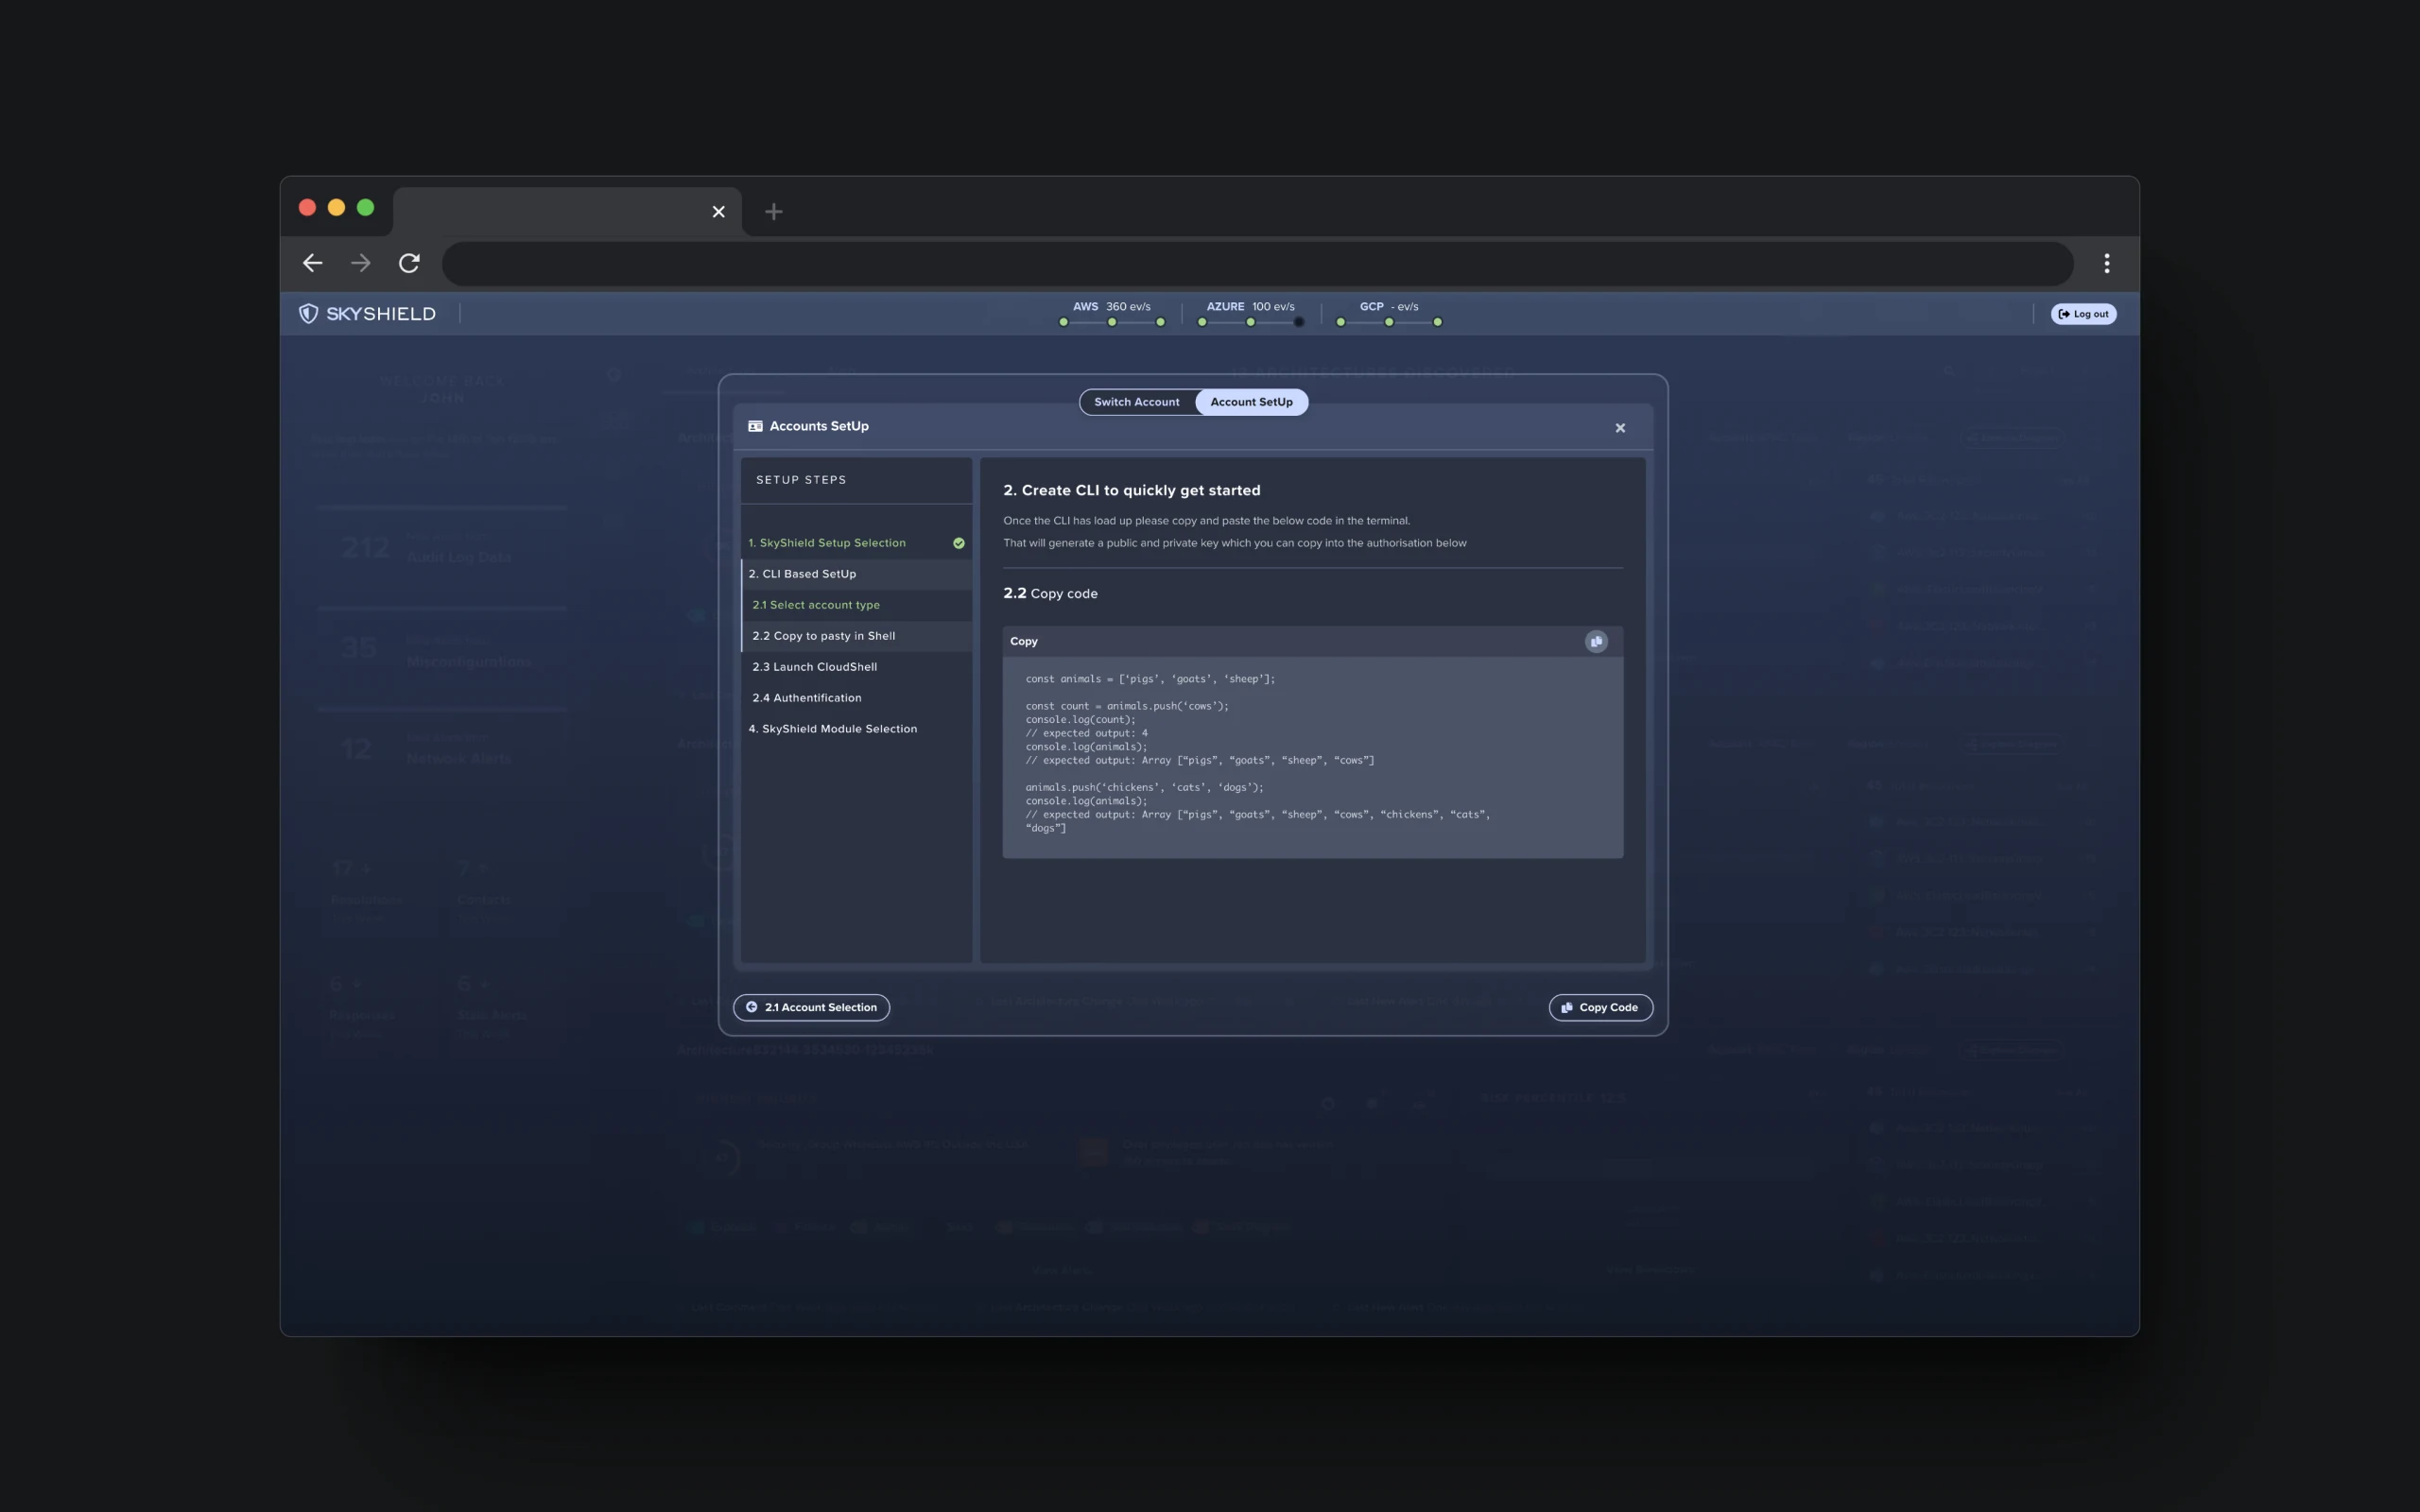
Dynamic cloud visibility
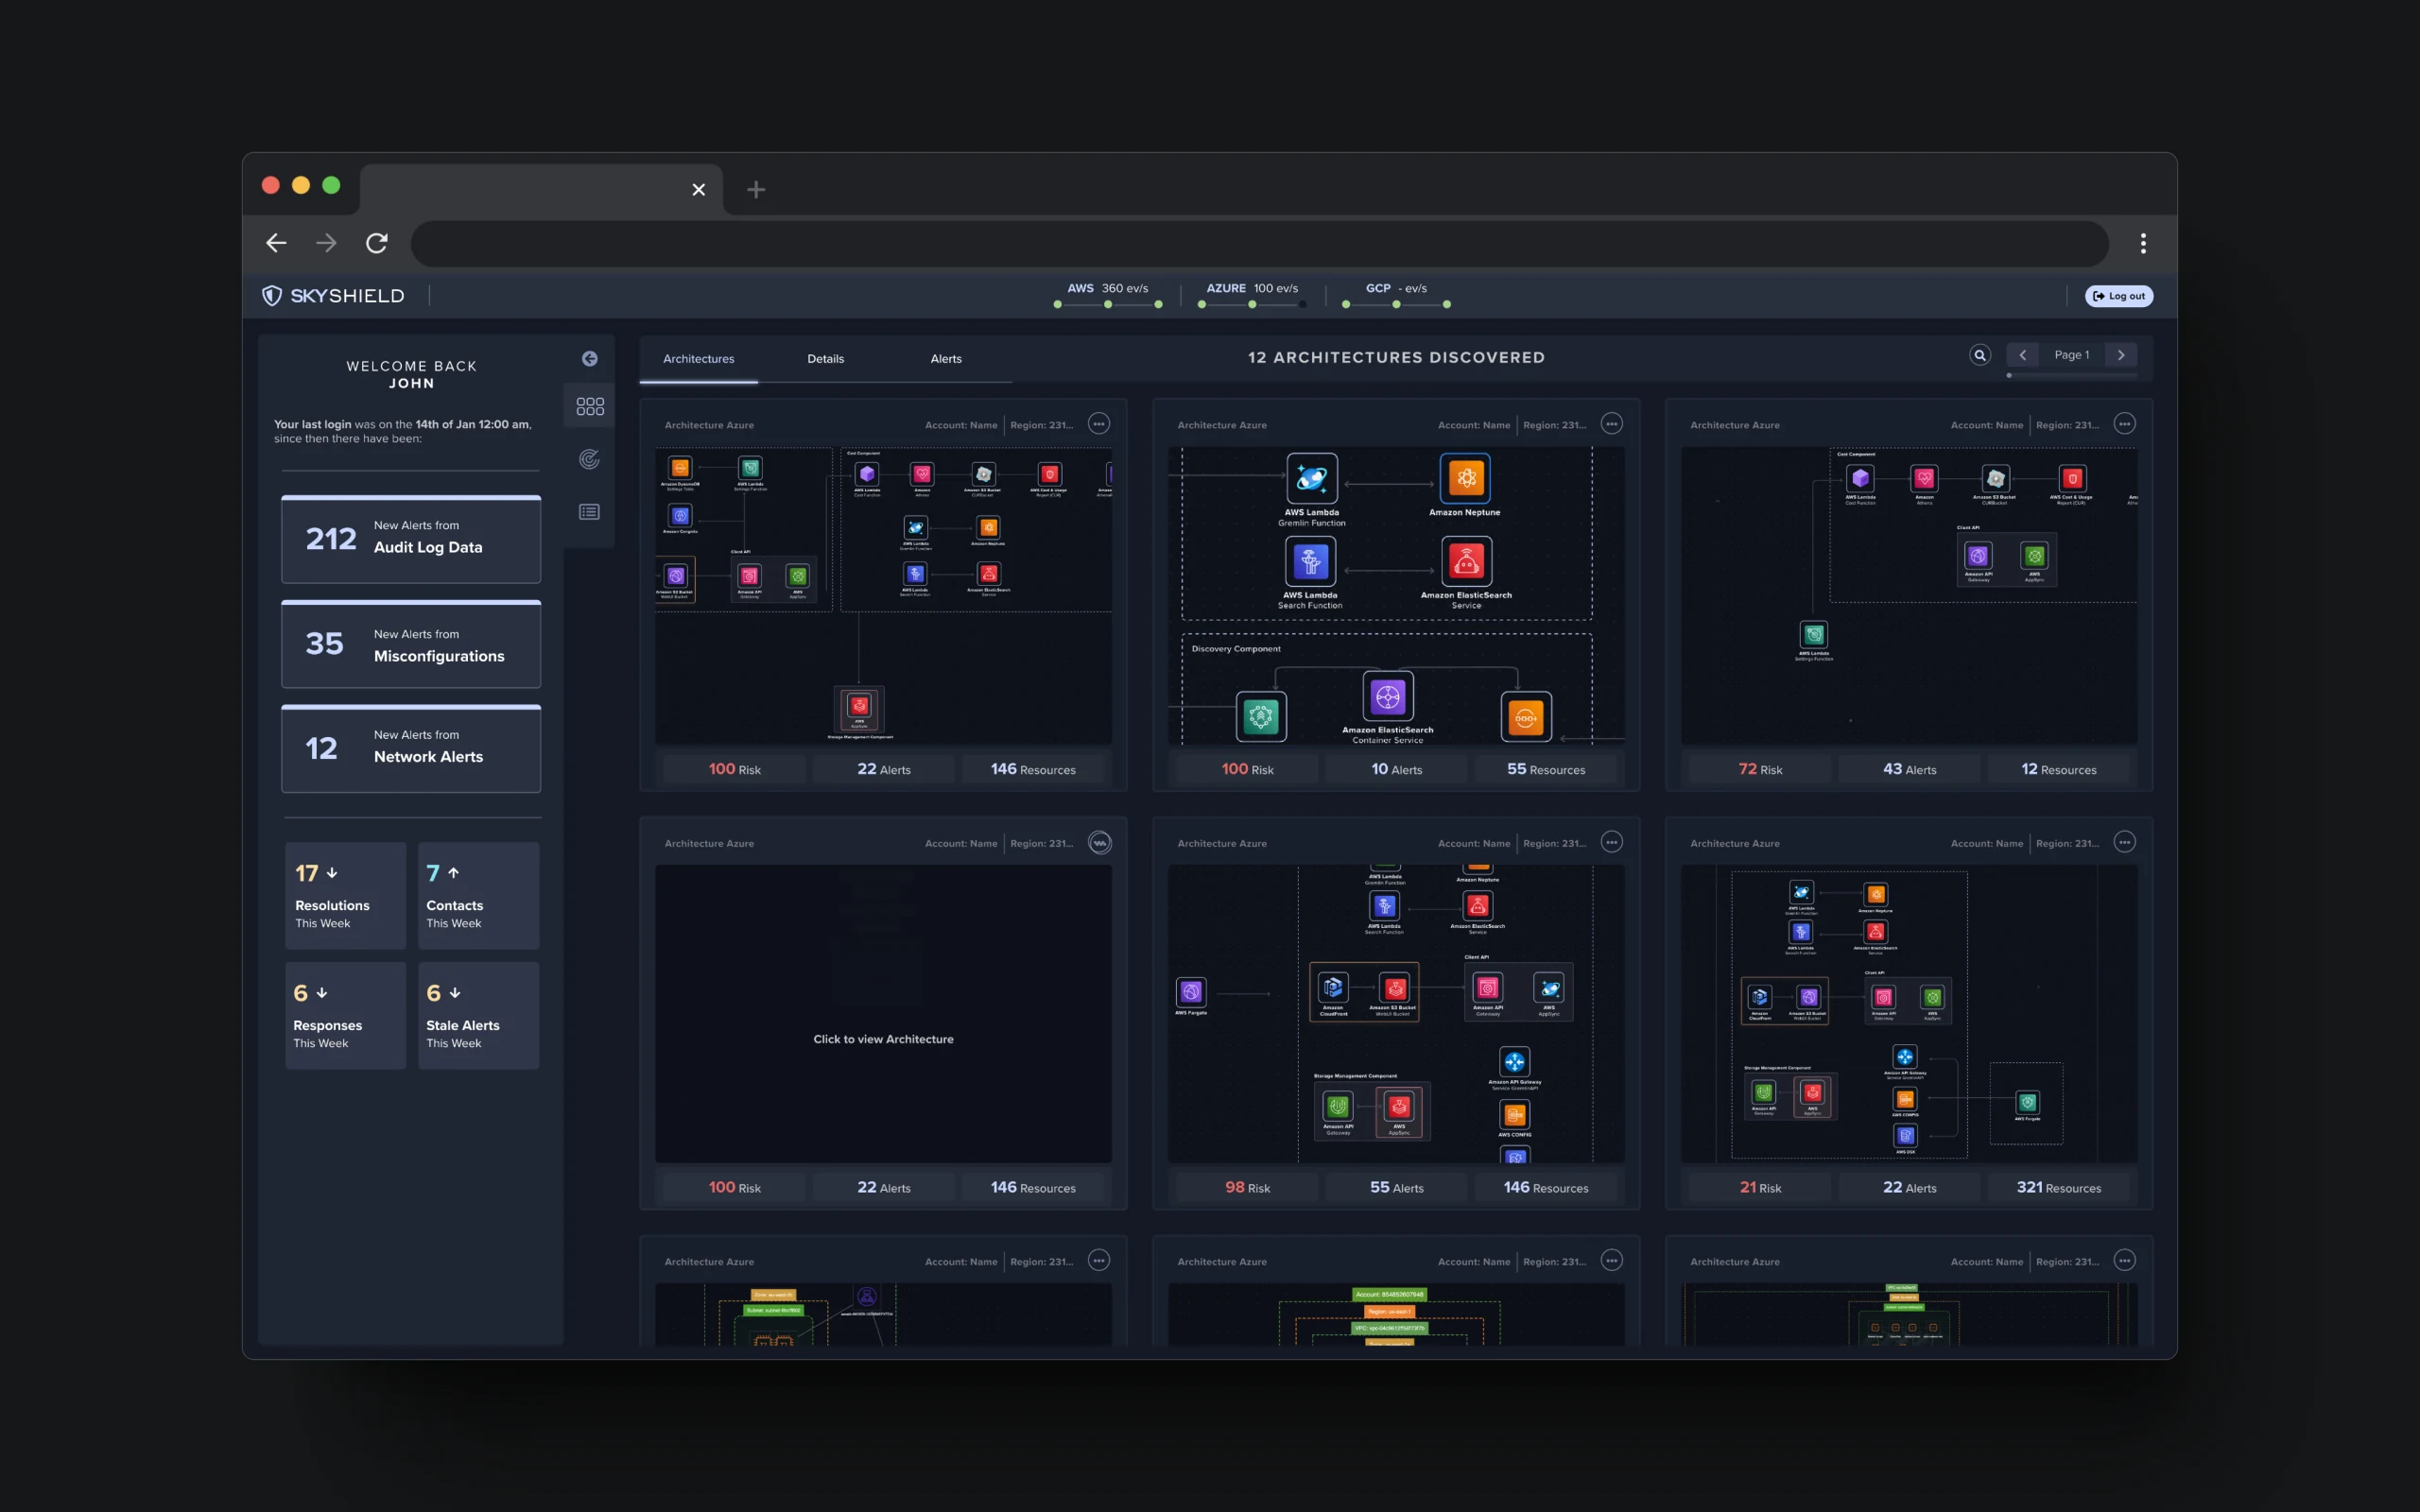
A live, connected picture of every asset across AWS, GCP and Azure — so nothing hides in the gaps between services.
Detect known and novel threats
The contagion model prioritises alerts by blast radius, surfacing what matters before it spreads.
Simplify and accelerate investigation
Modular data views let analysts move from alert to root cause without losing the thread.
An effortless experience
Responsive layout grids and a calm hierarchy minimise cognitive load in a dense, high-stakes domain.
A new design language.
A modular system with responsive layout grids — built to represent dense infrastructure data consistently while keeping cognitive load low.
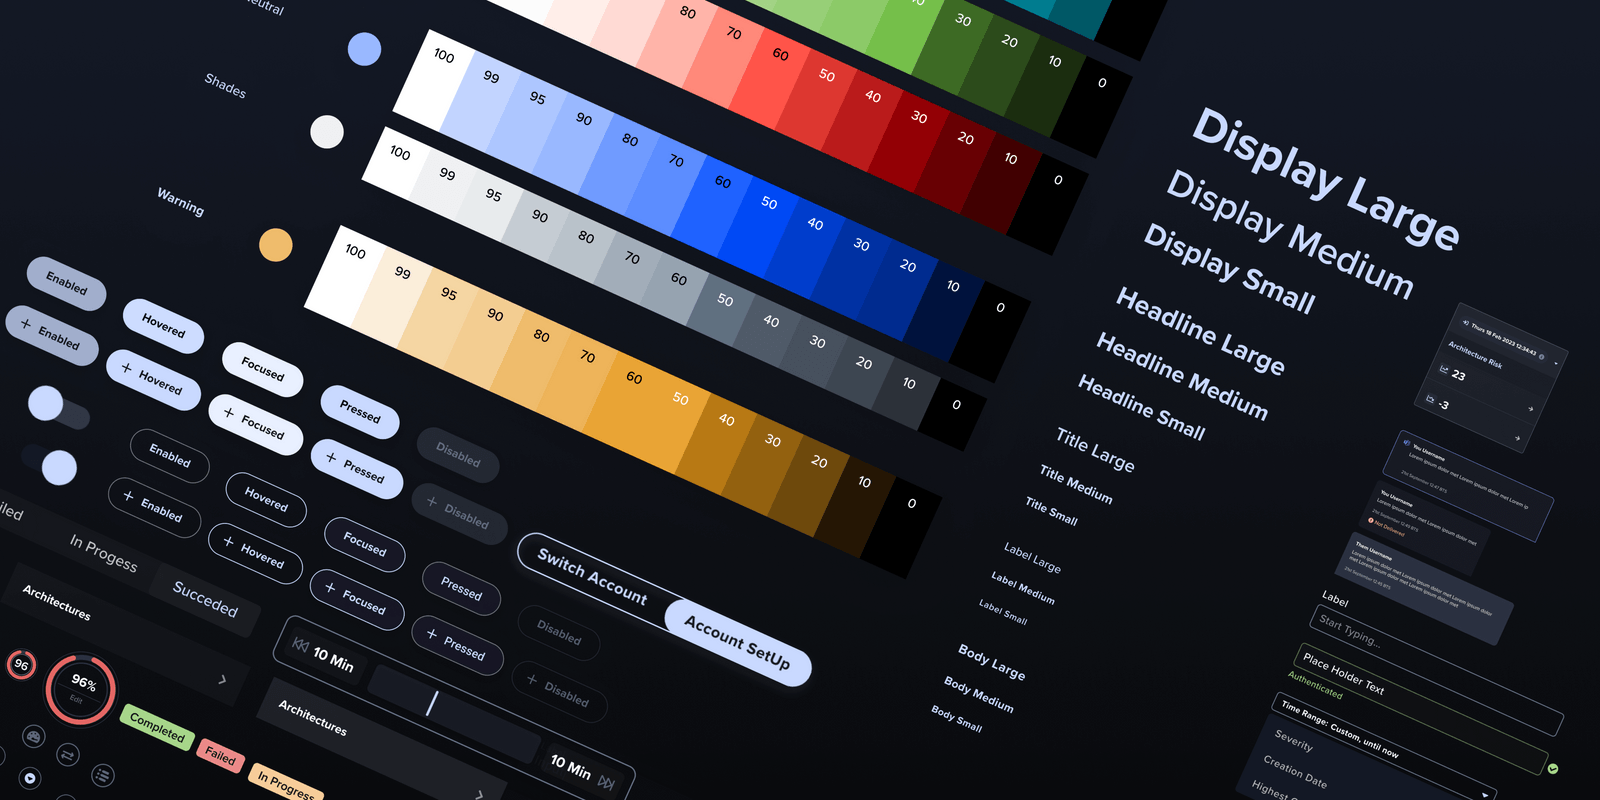
Bring real-time clarity to the chaos of multi-cloud security.
What I took from it
Map the system before the screen
Understanding where monitoring fits the cloud lifecycle made every later decision easier.
Design for new audiences
Serving DevOps and infrastructure experts — not just security teams — widened what the product had to do well.
Prioritise by consequence
A contagion model turned a flood of alerts into a ranked, actionable list.
Modularity scales
A modular data language let dense, multi-cloud information stay legible as it grew.